[ Case study ]
Go! Manage: Industrial Fleet & Asset Monitoring
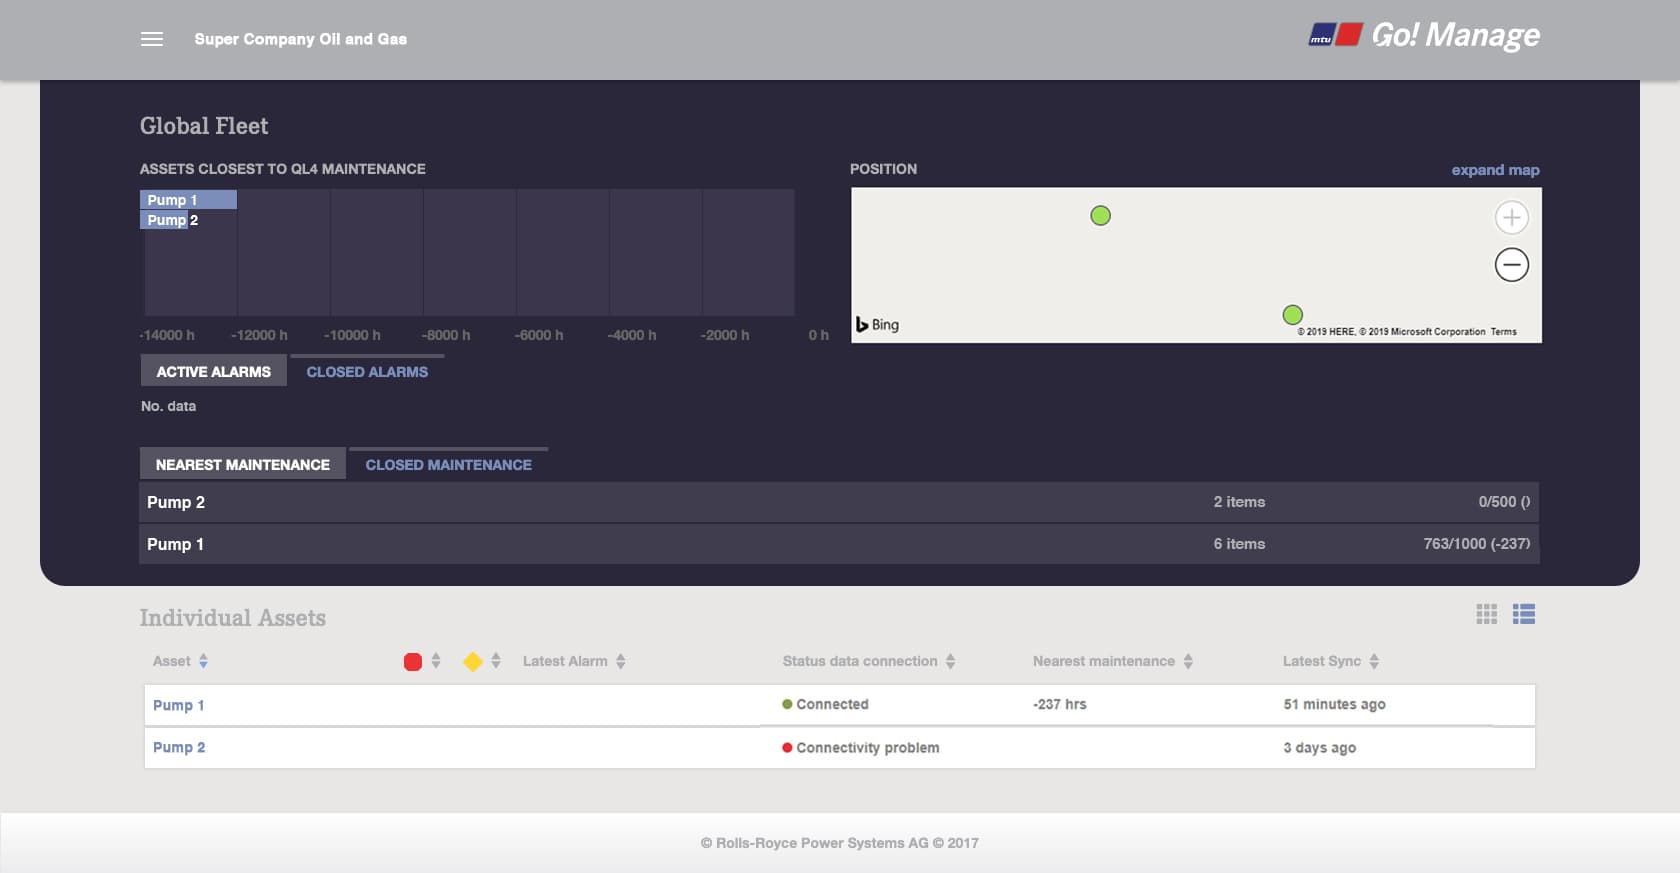
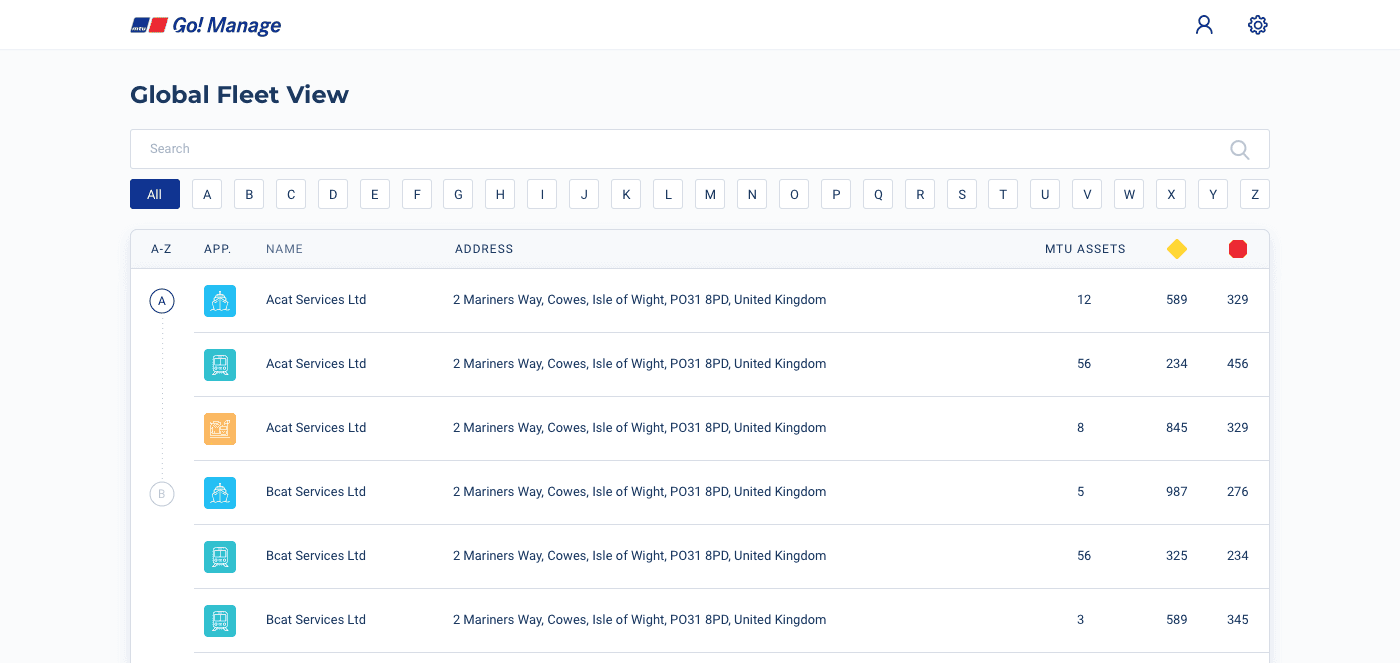
Go! Manage: a data-dense IoT platform for monitoring a global fleet of connected industrial engines, from a worldwide fleet view down to a single asset's live parameters, in dark and light themes, with a documented redesign of the legacy dashboard.
- Client
- Rolls-Royce Power Systems / MTU
- Role
- UX Architect · via Bosch/Mindtree
- Year
- 2019
- Disciplines
- Enterprise UX, IoT & Connected Products, Data Visualization, Dashboard Design, Design Systems
[ Impact ]
Fleet → Asset
Global fleet view drilling down to a single engine
Dark + Light
A dual-theme system for control room and field
Redesign
Legacy dashboard rebuilt for clarity at fleet scale
[ Information architecture ]
Global fleet
- Fleet/customer list
- Search
- Asset counts
- World map
Individual asset
- Operations
- Engine hours
- Position
- Parameters
- Graph view
Monitoring
- Active alarms
- Closed alarms
- Nearest maintenance
Theming
- Dark (control room)
- Light (field/office)
Confidentiality notice
This work spans active platform strategy, shared AI capabilities, and multiple product surfaces. To respect that, this case study stays intentionally high-level, focusing on the cross-brand design problem, platform principles, and reusable outcomes rather than brand-specific implementation details.
Go! Manage is the IoT platform Rolls-Royce Power Systems and MTU use to monitor a global fleet of connected industrial engines, marine, oil and gas, and power generation, in real time. I led the UX, including a redesign that made a dense legacy dashboard readable at fleet scale across dark and light themes. The on-screen data here is sample data only.
The challenge
An operator may be responsible for hundreds of connected assets spread around the world. The job is to find the few that need attention, an alarm, an approaching maintenance window, a lost connection, fast, and then drill into a single engine's live operating data. The legacy interface was dense and hard to scan. The product had to give clarity at fleet scale and depth at the asset level, and work in dark for the control room and light for the office and field.
- Triage a worldwide fleet by alarm, maintenance, and connection status
- Drill from the global view down to one engine's live parameters
- Stay legible under heavy real-time data, in both dark and light
[ Protected layer ]
The full case study is available on request.
High-fidelity screens, information architecture and the detailed process for this enterprise project are shared under NDA. Enter the access password, or request access and I will share the full walkthrough.