[ Case study ]
VCA: Doctor Compensation Platform
An enterprise tool that makes veterinary doctor pay legible at scale: a searchable directory of 11,452 doctors and a redesigned commission view that reads left to right as production, gross commission, salary, clawback, and net due. It reconciles three comp models, commission, pro-sal, and salary, and rolls period, quarterly, and annual earnings into one defensible figure, so complex, high-stakes math reads as plainly as a receipt.
- Client
- VCA Animal Hospitals
- Role
- Lead UX Architect · via GlobalLogic
- Year
- 2020
- Disciplines
- Enterprise UX, Data Tables, Dashboard Design, Information Architecture, Design Systems
[ Impact ]
11,452
doctors managed in one searchable directory
P1-P13
pay periods rolled up to quarter and annual
3
comp models reconciled: commission, pro-sal, salary
[ Information architecture ]
Doctor directory
- All doctors
- New doctors
- Update pending
View commission
- Filters
- Accrual file
- Commission file
Detailed commission
- Earnings
- Adjustments
- Period / quarter
- Pay
VCA pays thousands of veterinary doctors across hundreds of hospitals, and almost no two are paid the same way. Some are pure commission, some salaried, some a blend; some settle by period, some by quarter, some annually. I designed the platform that makes all of that legible - a place where administrators can find any doctor in seconds and see exactly how a number was reached.
The challenge
Compensation is where trust is won or lost with the people who deliver the care. The product had to hold genuinely complex rules - production-based commission, salary offsets, mid-cycle adjustments, multiple contract types - and still present a single, defensible figure. Two problems sat at the center: finding the right doctor among thousands, and explaining the math behind their pay without a spreadsheet.
- Make 11,000+ doctors and their many contract types searchable and filterable
- Show how commission is calculated, step by step, not just the total
- Reconcile period, quarterly, and annual views of the same earnings
The doctor directory
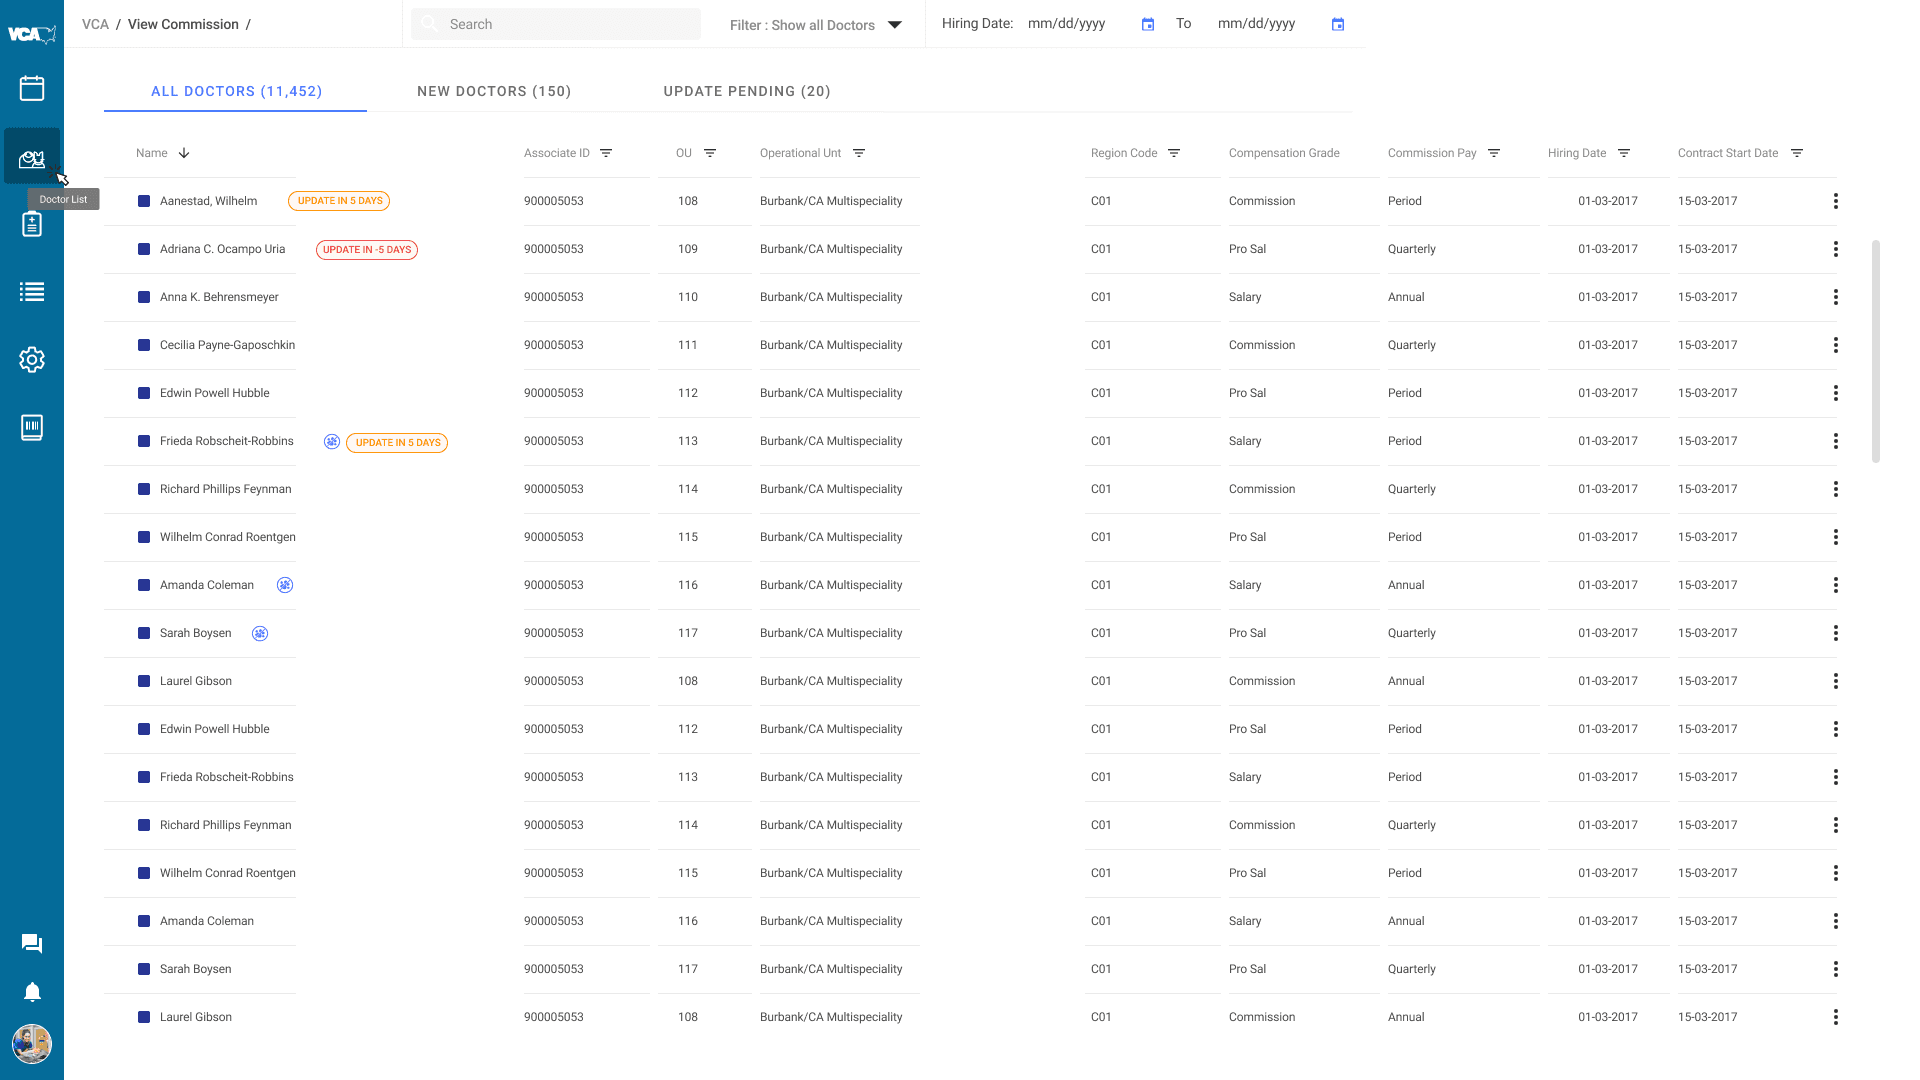
The entry point is a dense but calm data table. Administrators search and filter the full roster, with everything that matters in view at a glance: associate ID, operational unit, region, compensation grade (Commission, Pro Sal, Salary), pay frequency, and contract dates. Tabs split the work into All Doctors, New Doctors, and Update Pending, and amber and red status pills flag contracts that need attention before a deadline - turning a list of thousands into a prioritized queue.
View Commission
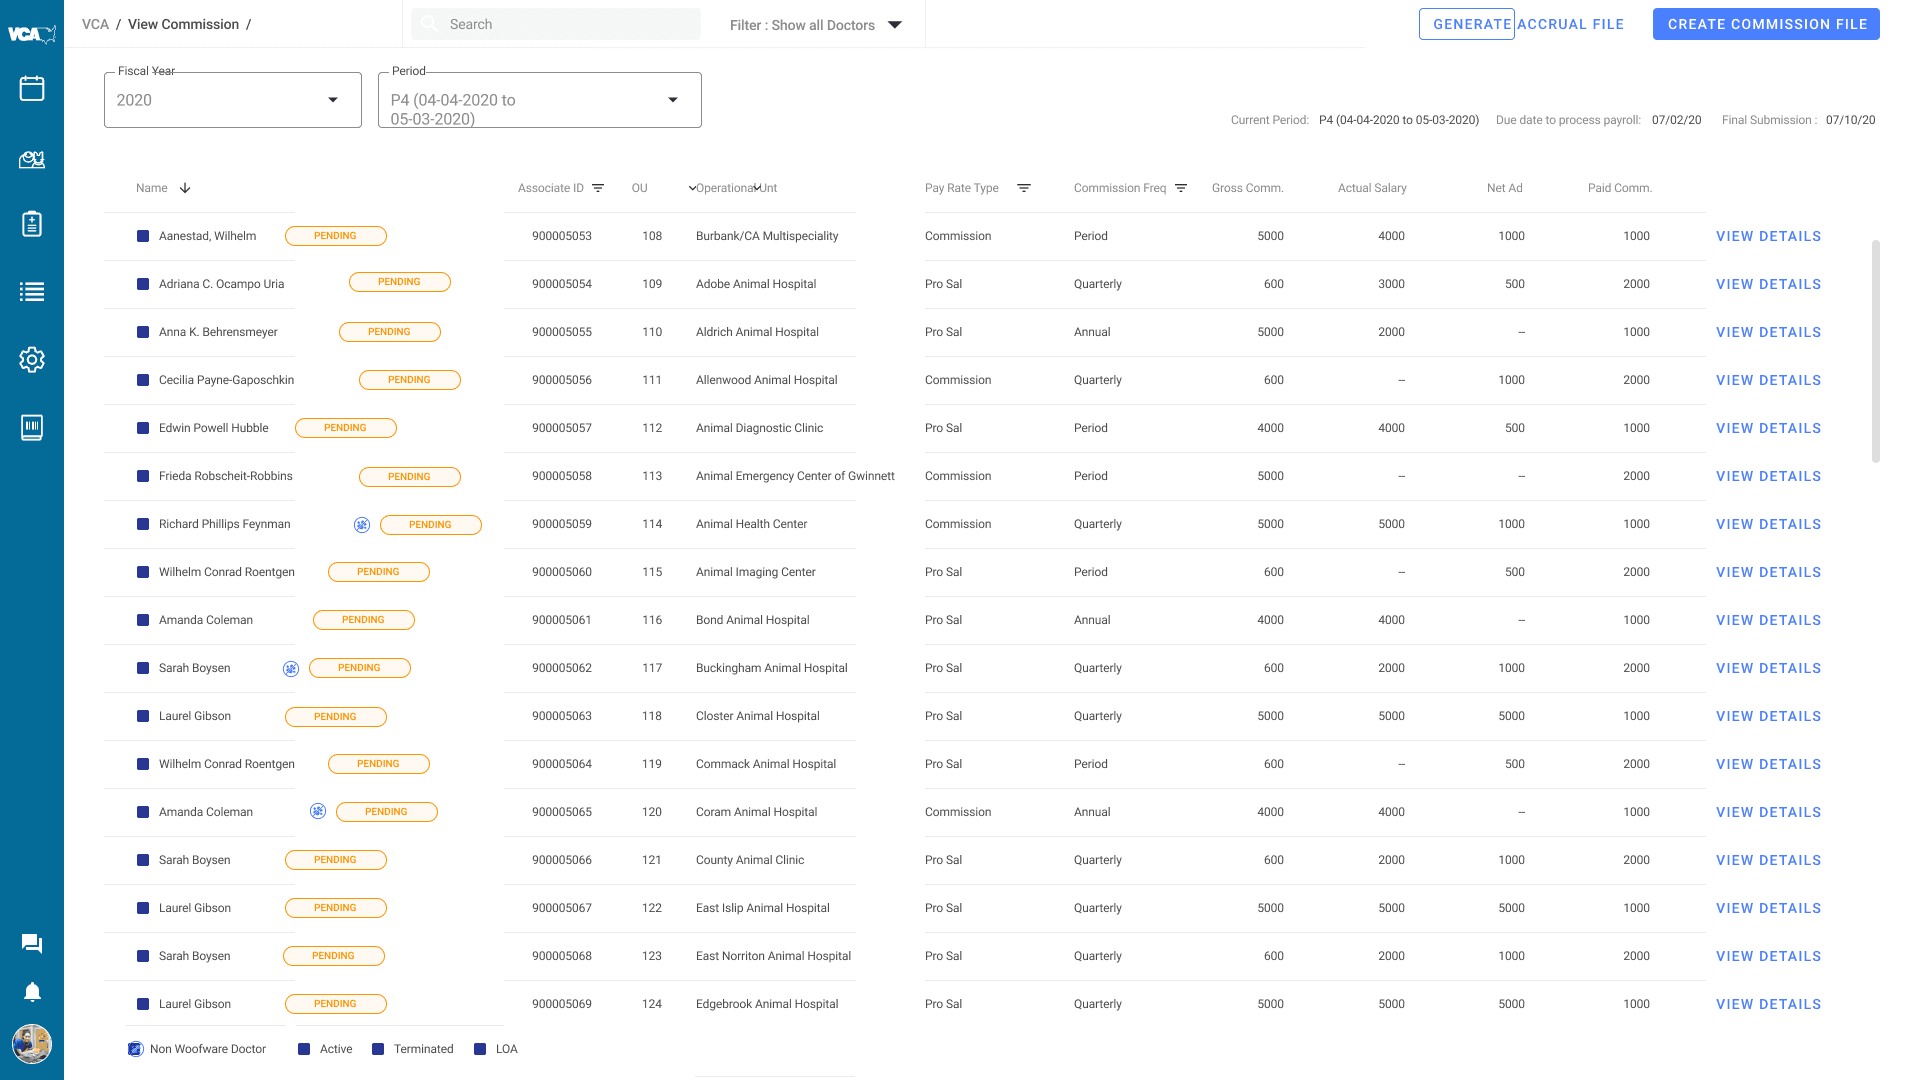
From the directory, administrators move into View Commission - the operational hub where pay is reviewed and run. They filter the roster, open any doctor's full breakdown, and generate the accrual and commission files that feed payroll, all from one screen.
The detailed commission view, redesigned
Selecting a doctor opens the heart of the product: their commission, made transparent. A header carries the essentials - associate ID, compensation grid, frequency, status, and total paid to date - and a fiscal-year selector with period tabs (P1 to P13) moves through the year. A redesign turned the breakdown into a visual calculation: each period reads left to right as production, gross commission, salary, clawback, and net commission due, so the math is followed, not assumed.
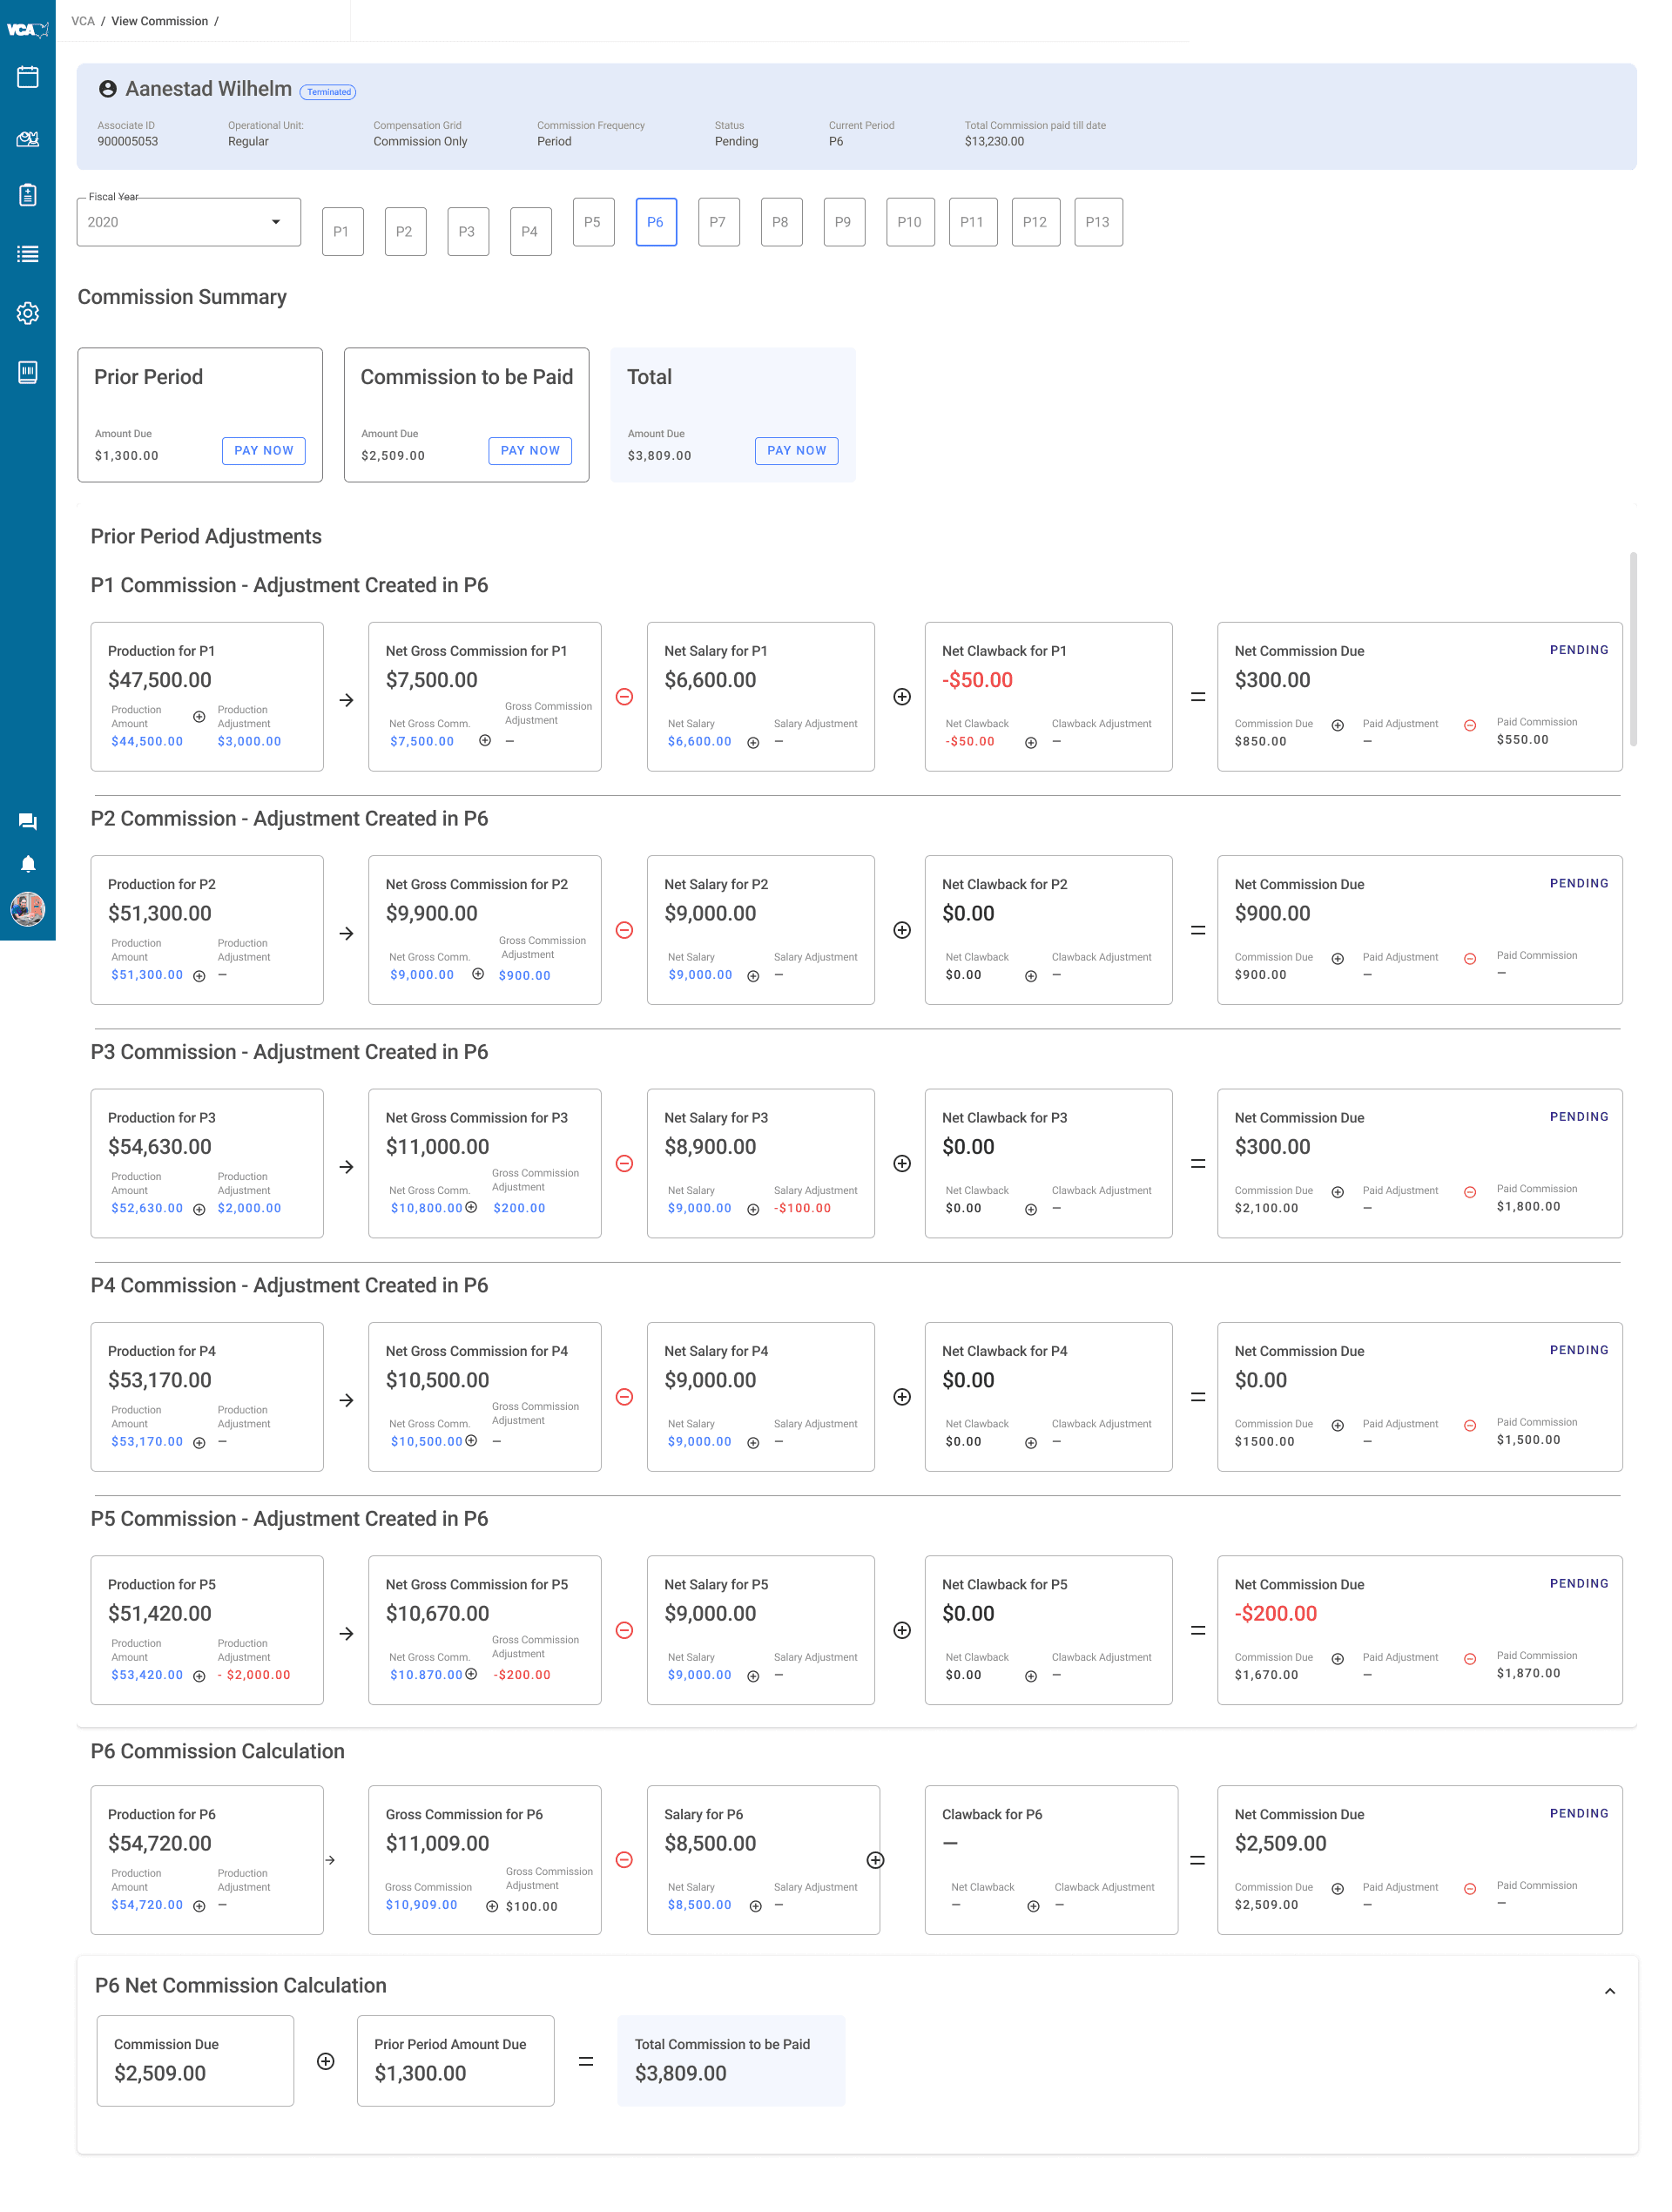
The hardest part was adjustments. Pay rarely settles cleanly in one period - a correction in P6 can reach back to P1 - so the redesign makes each adjustment its own legible row and rolls them all into a single, defensible total. Complex, high-stakes math, made as readable as a receipt.
Outcome
A compensation platform that scales to thousands of doctors without losing clarity for any one of them: fast to navigate, honest about its math, and consistent across every way the business looks at pay. The hard part was never the visuals - it was making complex, high-stakes financial rules feel obvious.
When the number affects someone's livelihood, the interface has one job: show the work, so the total is never in doubt.