[ Case study ]
DHL IoT: Admin Dashboard
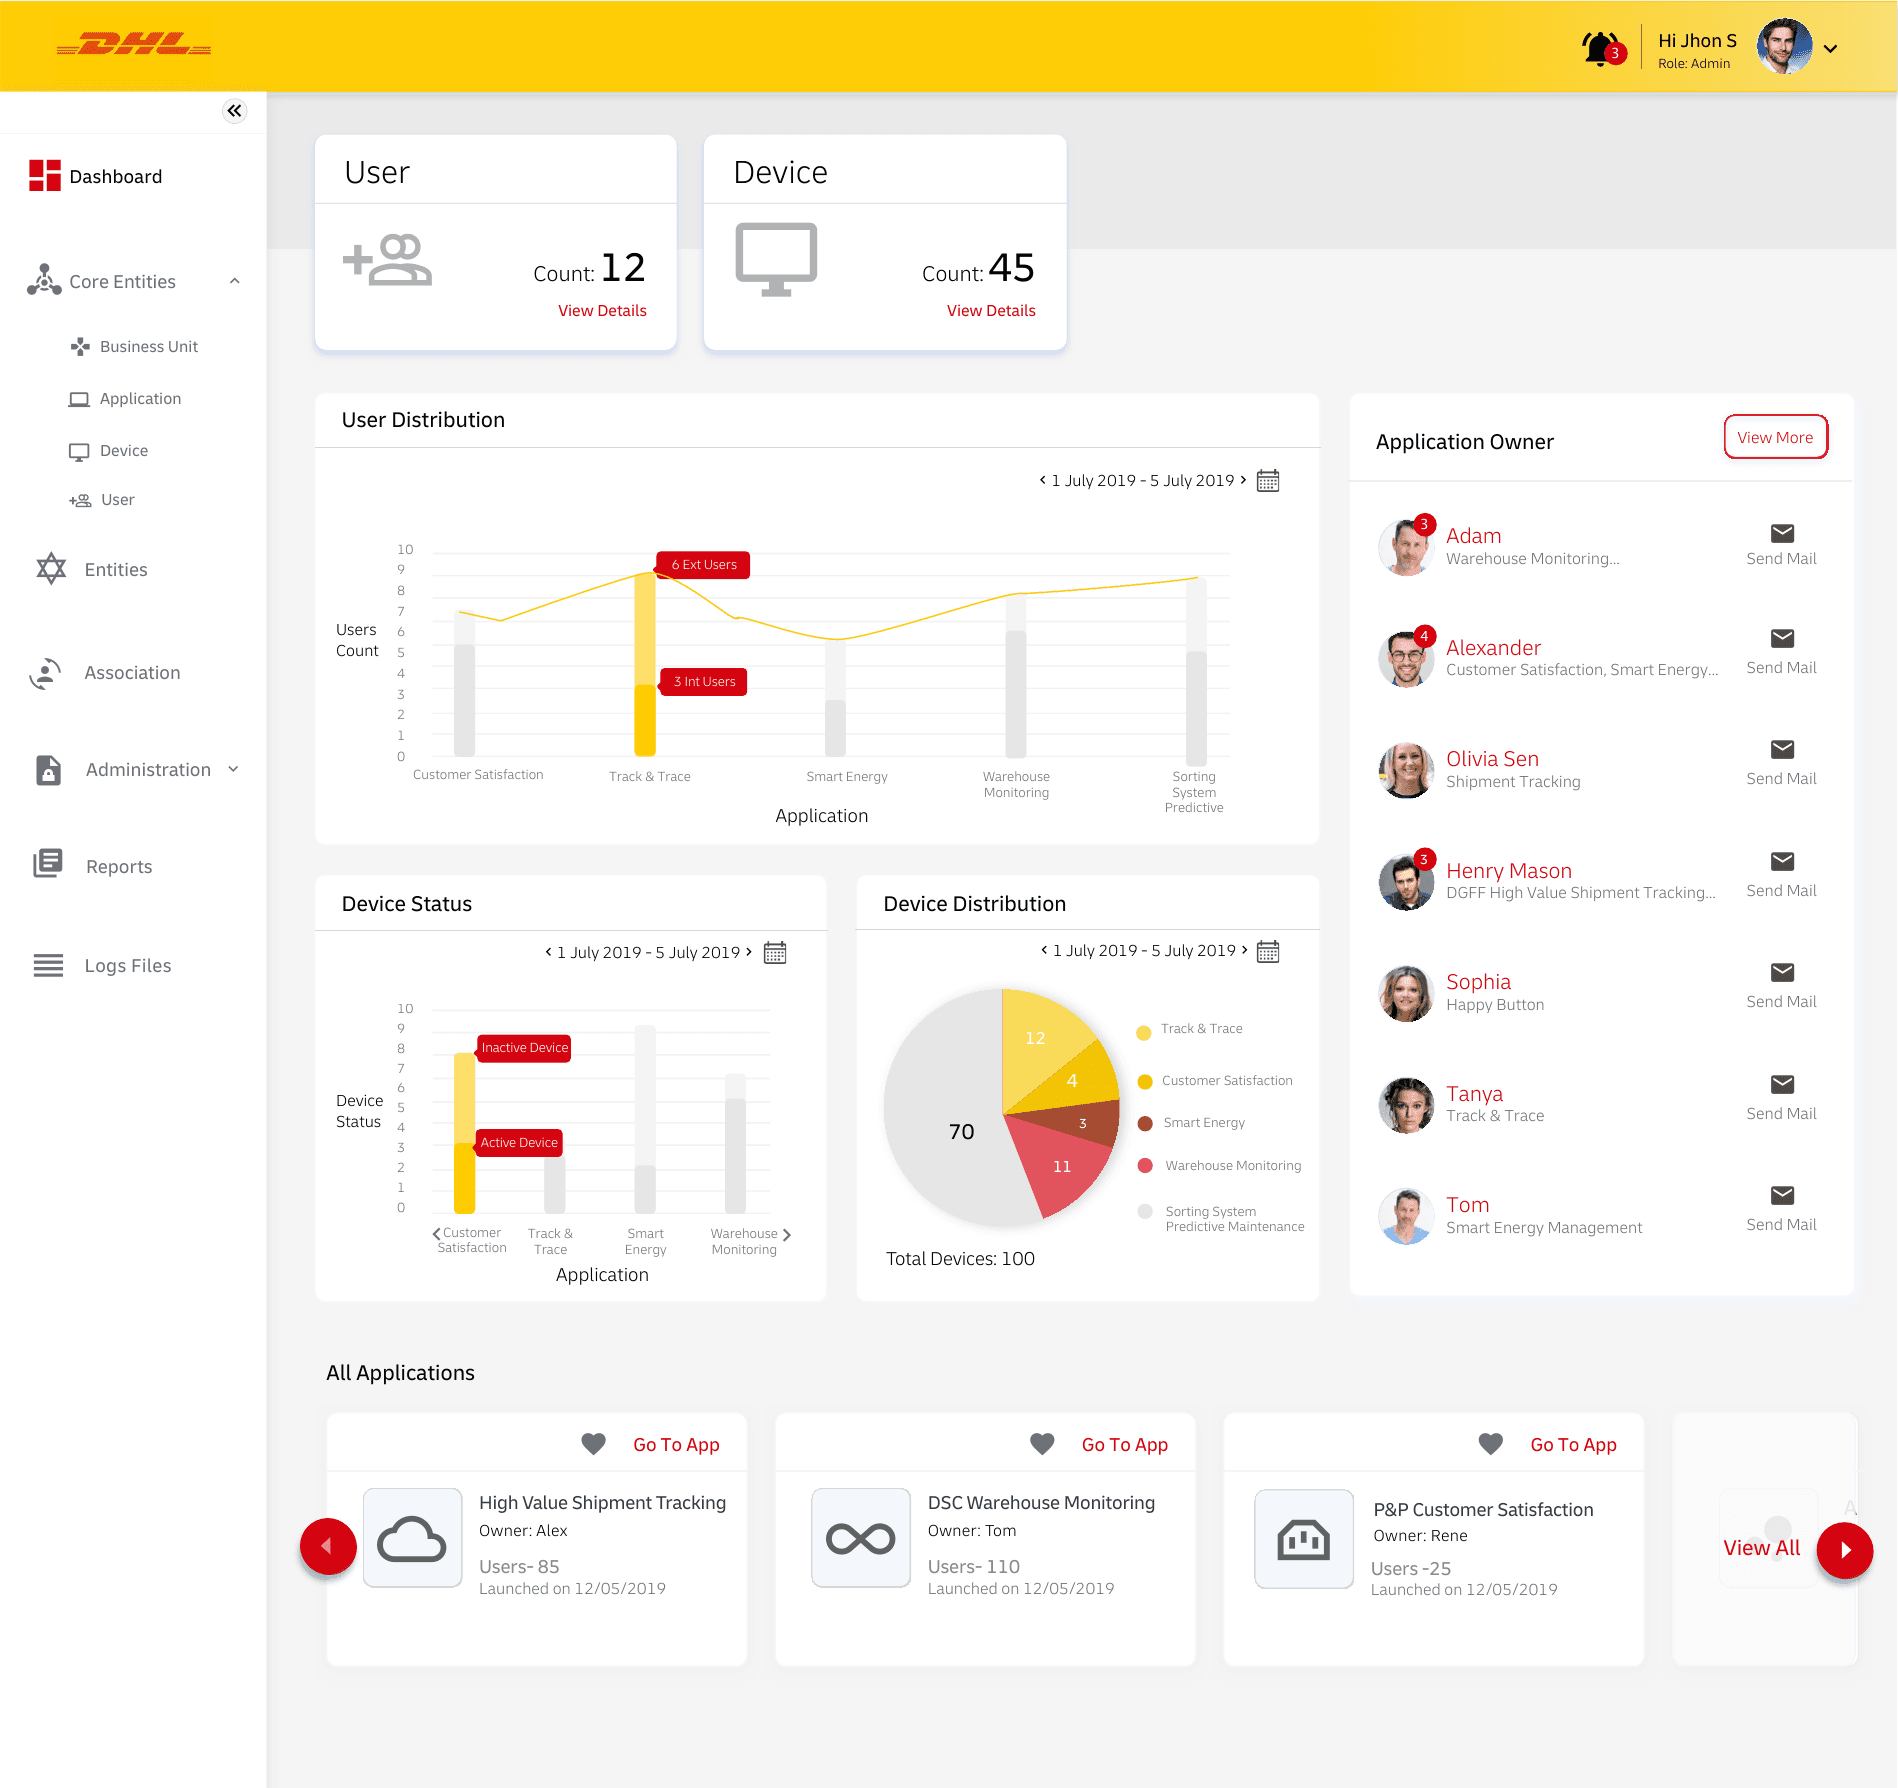
The control room of the DHL IoT platform, answering an administrator's first question, how is everything doing right now, before they drill into any single device or application. Live user and device counts lead as KPIs, with distribution and status charts, an application-owner directory, and an all-applications list keeping the people and products one click away.
- Client
- Deutsche Post DHL Group
- Role
- UX Architect · via Wipro
- Year
- 2019
- Disciplines
- Dashboard Design, Data Visualization, Enterprise UX
[ Impact ]
1
At-a-glance control room for the platform
4+
Live widgets: counts, distribution, owners, apps
[ Information architecture ]
Overview
- KPIs
- Status
Widgets
- Graphs
- Tables
Quick actions
- Shortcuts
The admin dashboard is the control room of the DHL IoT platform. It answers the administrator's first question - how is everything doing right now - before they drill into any single device or application.
Designed for the glance
Counts of users and devices sit at the top as immediate KPIs. Below them, user distribution and device status and distribution charts show trends over a selectable date range, while an application-owner directory and an all-applications list put the people and products one click away.
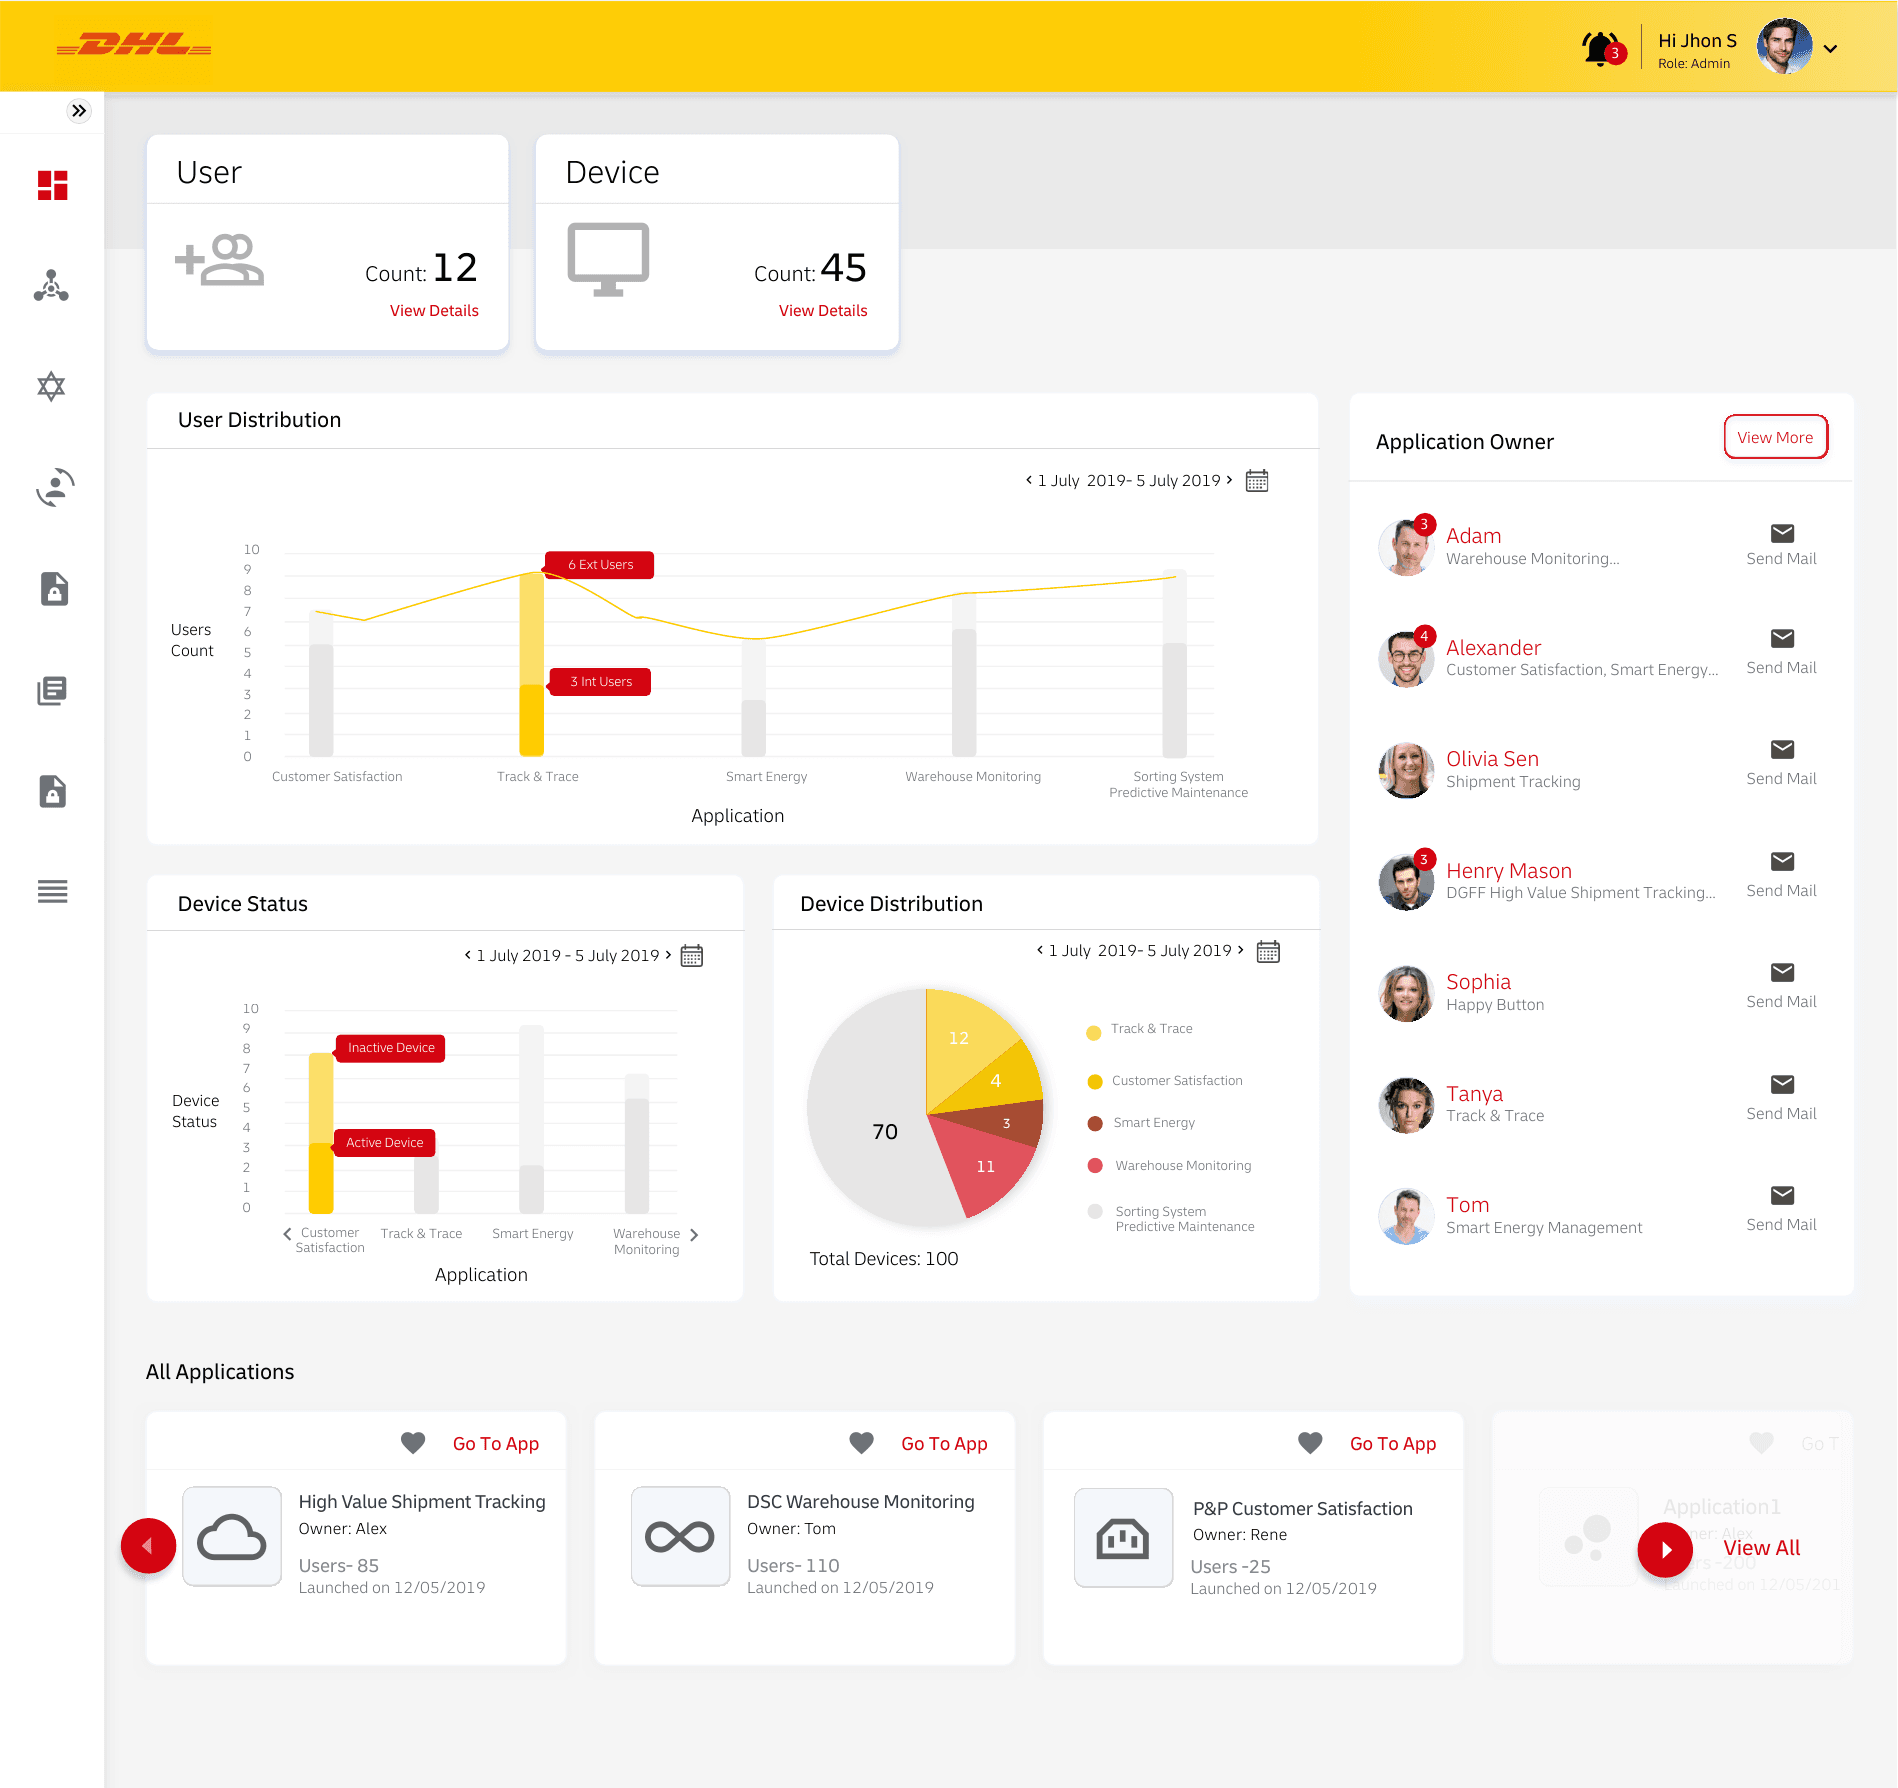
- KPI cards first - users and devices as the primary read
- Distribution and status charts for trends over time
- Application-owner directory with direct contact
- All-applications list with a quick path into each app
Outcome
A single screen that turns the platform's scattered signals - users, devices, applications, owners - into one scannable picture, with the DHL brand carrying status and hierarchy throughout.